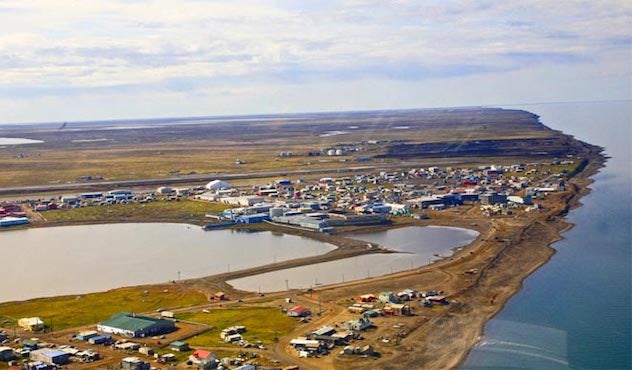
| Above: An aerial image of Barrow (Utqiagvik), Alaska. Barrow is located at a latitude of 71°17’26”, about 300 miles north of the Arctic Circle. Every month since December 2015 the temperature has averaged above normal here and, in addition, no daily record low has been set for almost 10 years now. As is obvious from the image, the unusual warmth that has occurred in recent years cannot be attributed to the “urban heat-island effect” nor to a climate cycle of some kind, at least for the city’s period of record since 1920. Image credit: Wikipedia. |
It was snowing and 10°F on Tuesday, April 25, in Barrow, Alaska (officially known as Utqiagvik). Hard to believe, but this is close to what the normal temperature should be for this time of year at this frigid outpost on the shores of the Arctic Ocean. Nevertheless, this month (April 2017) is on course to close out as the 16th consecutive month with above-average temperatures at the site.
The last time that Barrow experienced a month that averaged below normal (temperature-wise) was December 2015. Here is the list of monthly departures since then:
Barrow Monthly Temperature Departure from Normal, Dec. 2015-April 2017
Apr 2017: +5.0°F (as of April 24)
Mar 2017: +5.3°F (1 daily record high)
Feb 2017: +8.0°F (1 daily record high)
Jan 2017: +13.1°F (3 daily record highs) (highest January temperature on record tied with 36°F on Jan. 1)
Dec 2016: +7.9°F
Nov 2016: +12.6°F
Oct 2016: +12.9°F (5 daily record highs) (warmest October on record) (highest October temperature on record of 44°F on Oct. 10)
Sep 2016: +1.9°F (2 daily record highs)
Aug 2016: +0.8°F
Jul 2016: +2.8°F
Jun 2016: +1.9°F (2 daily record highs)
May 2016: +7.6°F (5 daily record highs)(warmest May on record)
Apr 2016: +8.5°F
Mar 2016: +5.4°F
Feb 2016: +10.1°F
Jan 2016: +13.1°F
Dec 2015: –2.7°F
During the time frame of January 2016-April 2017 a total of 19 daily record highs have been set versus zero (0) daily record lows. All of the daily record highs have actually occurred in just the past twelve months (since May 2016). In fact, the last time Barrow set a daily record low was almost 10 years ago on December 21, 2007, when a reading of -42°F was achieved. The POR (period of record) for Barrow began in November 1920. With a POR of 96 years, Barrow should expect to see an average of 4 daily record highs and 4 daily record lows established each year. So for the POR of 2008-2017 (April) of 9.3 years, there should have been a total of about 37 daily record highs and 37 daily record lows if the climate were in perfect equilibrium. In fact, the total number of daily record highs set in this span has been 65 versus (as mentioned) zero daily record lows. Yes: 65 to 0 over the past nine years!
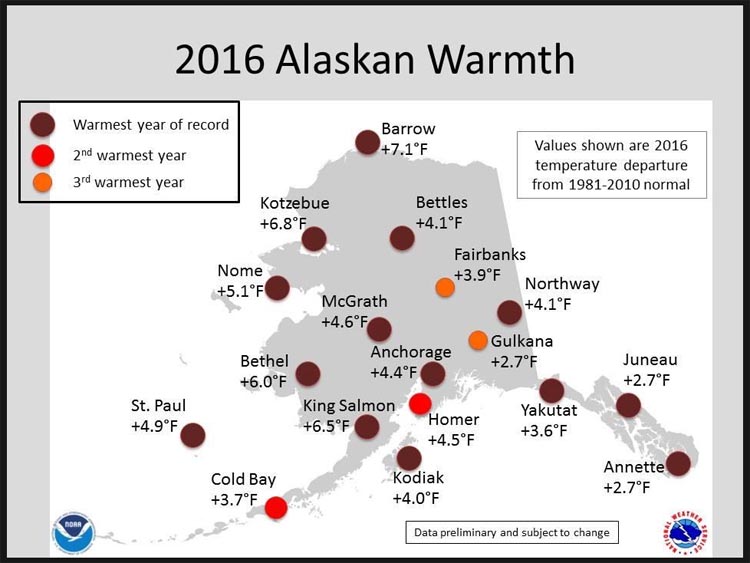
The year 2016 was the warmest year on record for Barrow, with an annual average temperature of 18.9°F, or 7.1°F above the annual normal of 11.8°F. (Note: a 19.8°F average for 1929 in the National Weather Service NOWData archive is missing the temperature data for December of that year). The previous warmest year was 1998 with a 17.0°F average. The last year to average below normal in Barrow was 23 years ago: 1994. Eight of the ten warmest years have occurred in just the past ten years (since 2007).
Top 10 Warmest Years on Record for Barrow, Alaska (POR 1921-2016)
1. 18.9°F, 2016
2. 17.0°F, 1998
3. 15.3°F, 2007
4. 14.9°F, 2014
5. 14.4°F, 2013
6. 14.3°F, 2010
7. 14.1°F, 2015
8. 14.0°F, 2011
9. 13.9°F, 1940
10. 13.4°F, 2009
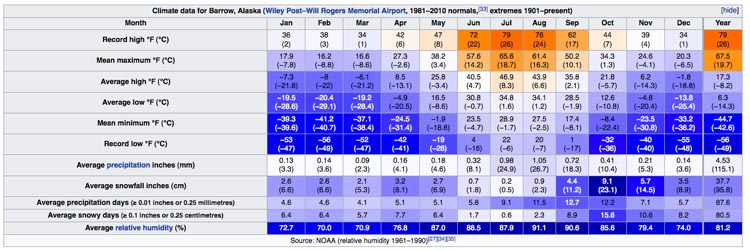 |
| Figure 1. Table of climatological statistics for Barrow. The average temperatures are based upon the latest 30-year POR of 1981-2010. The departures from normal outlined in the list I made above (for the months of December 2015-April 2017) are based upon this POR. Image credit: Wikipedia. |
It was not just Barrow that experienced its warmest year on record in 2016. Alaska as a whole also observed such, with most towns and cities registering their warmest year ever observed.
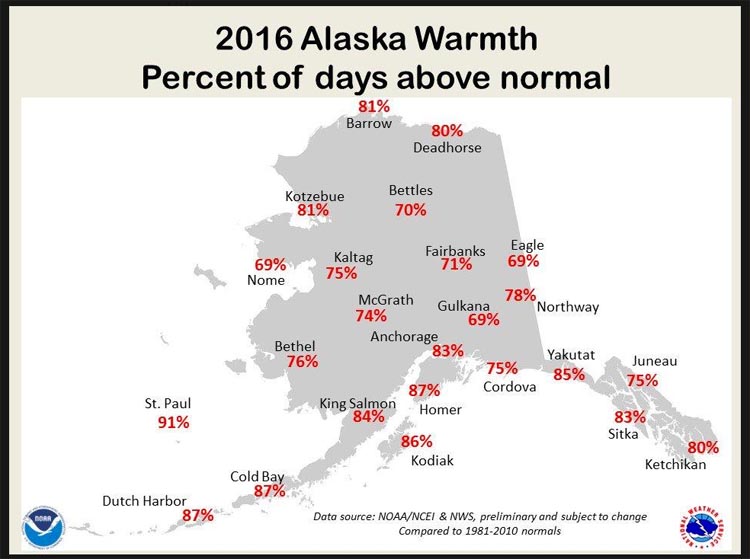
The amazing persistence of above-normal temperatures during the year 2016 can be seen in Figure 3 below.
|
| Figure 2. Although Barrow saw the greatest departure from normal for the year 2016, other cities also saw record warmth as illustrated in the map above. Image credit: NOAA/NWS. |
 |
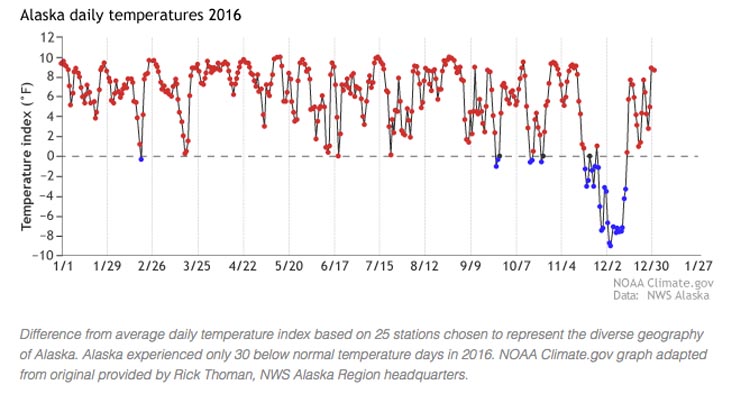 |
| Figures 3 and 4. An amazing 81% of the days in 2016 saw above-normal temperatures in Barrow. This trend was a statewide phenomenon as can be seen in this map and the graph below it. Note how extreme the percentage of days above average was at the Aleutian Island/Peninsula sites of Dutch Harbor and Cold Bay (87%) as well as on St. Paul Island in the Bering Sea, where an astonishing 91% of the days experienced above average temperatures. Image credit: NOAA/NWS. |
As is now well observed, the Arctic region of the world has been warming faster than any other on the planet leading to a shrinking extent of Arctic sea ice and melting permafrost. If there is a “canary in the coal mine” (so to speak) concerning climate change, it can be witnessed in the climate data from Arctic sites like Barrow.
Christopher C. Burt, Weather Historian
