| Above: A man rides his bicycle along a pier at Fort Baker Friday, Sept. 1, 2017, near Sausalito, Calif. The San Francisco skyline is barely visible in the background through smoky skies. In downtown San Francisco, where temperatures have been measured since 1874, the high of 106°F on Sept. 1 set an all-time record, beating out 103°F from June 14, 2000. Image credit: AP Photo/Eric Risberg. |
A daily, or even monthly, temperature record (whether hot or cold) is an impressive, headline-grabbing feat. Even more significant is when a city or town sets a record for the average temperature across an entire year. This takes all four seasons into account, whereas week-long or even month-long heat waves or cold waves tend to be ironed out over the course of a calendar year.
Applying the same methodology employed in my post in May concerning daily temperature records, I decided to check the data for the same 60 sites in the contiguous U.S. (plus six in Alaska and Hawaii) to determine their warmest and coolest individual years on record. In addition, I compared the yearly temperatures averaged across three different periods of record (PORs): 1895-1980, 1981-2010, and 2011-2016. The current 30-year POR used by the NWS and NOAA is 1981-2010, and the interval from 2011 to 2016 will become part of the next official 30-year period of record (1991-2020).
Methodology
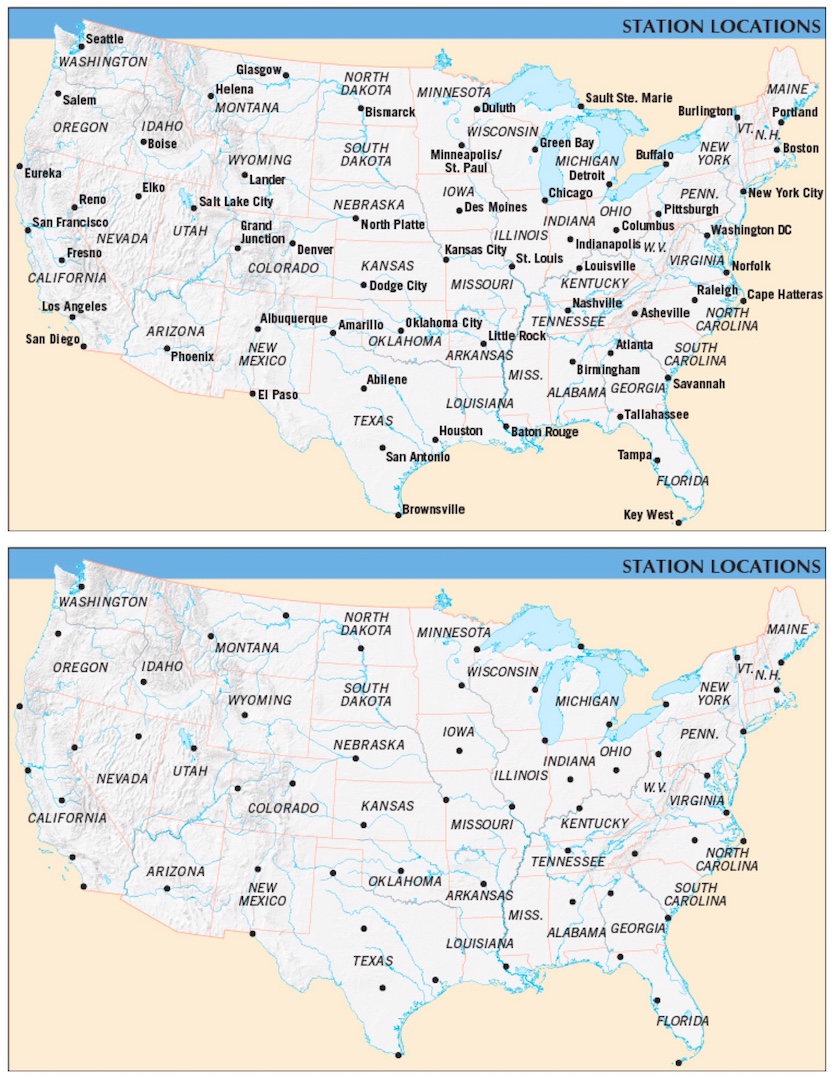
I chose these 60 towns and cities because of their geographic distribution (more or less evenly spread across all geographic regions of the U.S.) and also for PORs that go back to at least 1895 in NOAA’s NOWData files (NOAA Online Weather Data). I also made a point of including some small towns in significant geographic locations such as Cape Hatteras, North Carolina, and Glasgow, Montana, to see if trends extend beyond the urban heat islands in big cities.
 |
| Figures 1 and 2. Sites chosen for this study. Location names are omitted in the bottom map to draw attention to their geographic distribution. All of these sites have daily temperature records in NOAA NOWData that go back to at least 1895. |
Although most of these sites have PORs that pre-date 1895, I used that year as the beginning date for all the temperature record searches, so that all the sites would have the same PORs (thus I would be comparing apples to apples). Some major cities could not be included because their NOWData information began after the 1895 threshold. These include New Orleans (1946-), Charleston (1938-), Las Vegas (1939-), Dallas (1898-), Portland (1940-), and Billings, (1934-). For most of these sites, I used other cities in the region that did have data from 1895 as rough surrogates. For instance:
New Orleans, LA = Baton Rouge
Charleston, SC = Savannah
Portland, OR = Salem
Billings, MT = Glasgow
Dallas, TX = Abilene
Las Vegas, NV = unfortunately, there are no nearby sites with POR’s from 1895 to fill this significant regional gap.
After choosing these sites, I used the option in NOWData’s local search tool to search the average annual temperatures recorded in each city for each year from 1895 through 2016.
Data for Hawaii and Alaska. These are not included in the table data averages, since only one site (Honolulu) has a POR that dates back to 1895. The figures included here are for those curious. Anchorage’s POR is so short in NOWData (since 1953) that it would not be useful to include; likewise for Hilo in Hawaii (with a NOWData POR since only 1949).
Issues with data from some locations
The urban heat island (UHI) effect has most likely had a profound effect on the annual temperature records for many sites, especially for rapid-growth urban areas such as Phoenix.
 |
| Figures 3 and 4. Phoenix has grown from a small desert city of about 2500 in the 1880s to a sprawling urban area with a metro population of more than 4 million. The city’s average annual temperature has increased by around 5°F during this period of time, in large part because of the urban heat island. Climate change has also played a role, though, since average annual temperatures have risen for even non-urbanized sites. Image credits: Wikipedia (left), Melikamp via Wikipedia (right). |
Complicating things further, the location of the instruments in most of the cities researched has moved at least once (if not more often) over the course of the past 122 years. This is particularly noteworthy in the case of Kansas City, whose average annual temperature dropped by 1.2°F after its official NWS site was moved in 1972 from downtown to the airport 20 miles northwest. The city’s official average annual temperature fell from 55.7°F (POR 1895-1972) to 54.5°F (POR 1973-2016) following the relocation. Warmer weather since 2010 has brought that average back up to 55.4°F for the POR of 2011-2016 (see table below).
Although UHI and instrument relocations can have a significant local effect, they alone cannot account for the overall nationwide picture of an increase in annual average temperature witnessed by all but one site since 2010.
The data
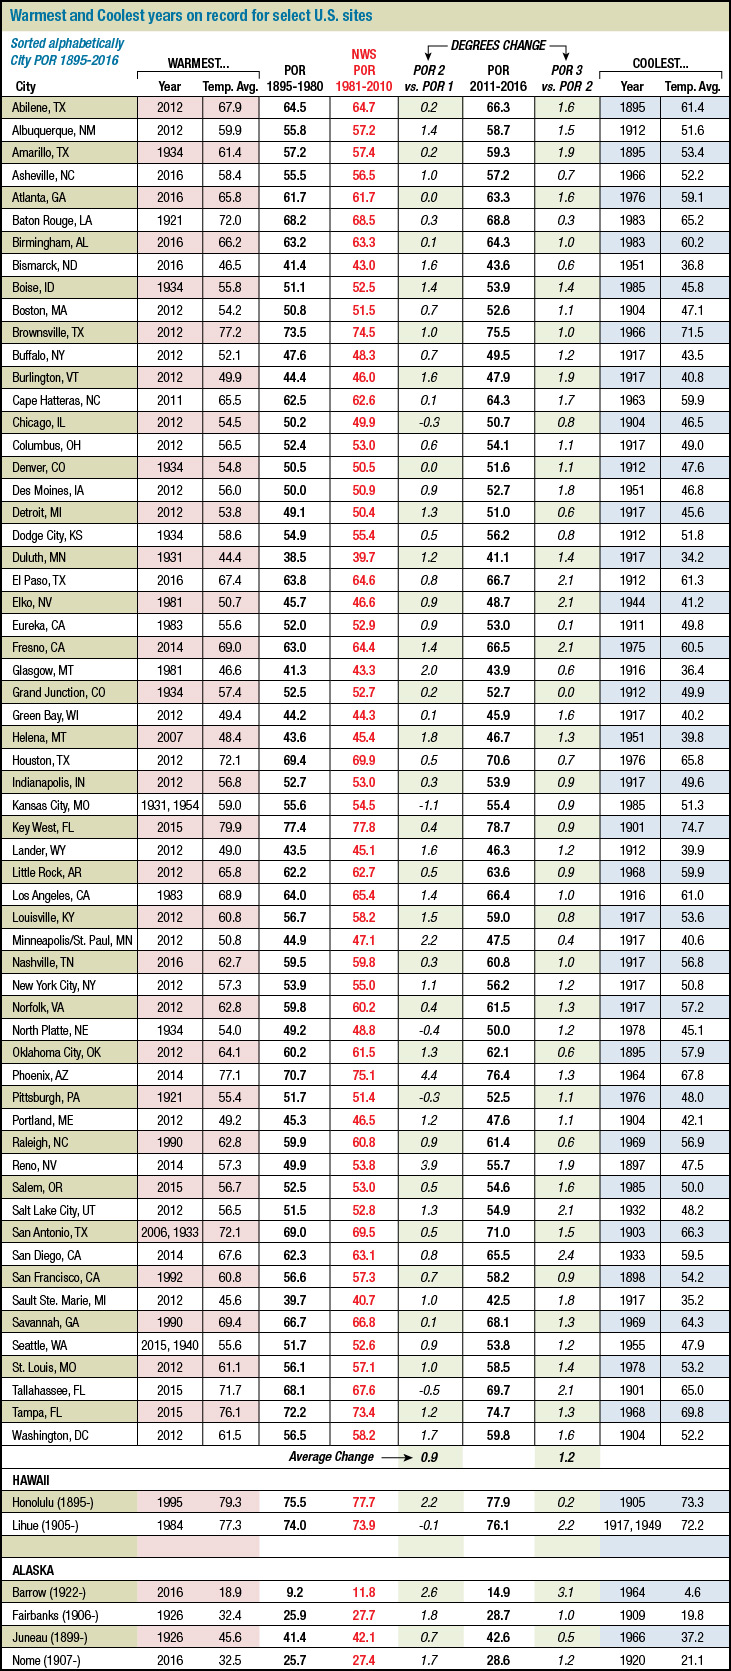
Not surprisingly, some years loom large for both coldest years on record and warmest years on record. The years 2012 (when 25 sites experienced their warmest year on record), 2016 (six sites), and 1934 (six sites) accounted for more than half (37 out of 60) of all the sites’ warmest years on record. Conversely, 1917 (when 13 sites saw their coldest year on record), 1912 (six sites), and 1904 (four sites) accounted for more than a third (23 sites) experiencing their coldest year on record.
 |
| Figure 5. Annual average temperature data for 60 sites in the continental U.S. with PORs of 1895-2016 and six sites in Hawaii and Alaska with varying PORs (which are in parentheses next to the site names). The POR currently in use by the NOAA and NWS is that of 1981-2010; every ten years, the 30-year POR moves forward by a decade, so the next POR will be 1991-2020. |
 |
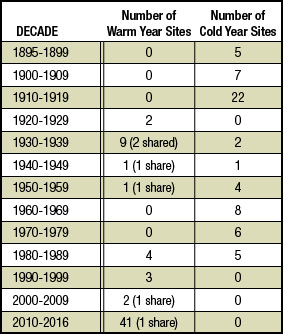
| Figure 6. Number of sites (out of 60) that experienced their warmest and coldest years on record in each decade from 1895 to 2016. The ‘share’ means that some sites tied their warmest years on record on two different occasions (see Figure 5 above for those). |
 |
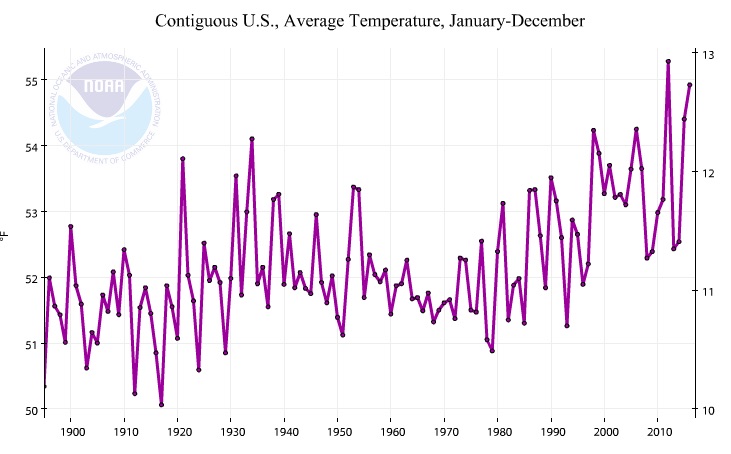
| Figure 7. Average annual temperature for all contiguous U.S. sites from 1895 to 2016. Note how the coldest and warmest years coincide quite well with the data for the 60 sites used in my research. Image credit: NOAA/NCEI. |
Conclusions
—For the locations in the contiguous U.S. examined in this study, the past six years (POR 2011-2016) have seen average annual temperatures that are 1.2°F above the current 30-year climatological average used by NOAA (1981-2010). This has also occurred in Alaska and Hawaii. This increase is striking if we note that the average annual temperatures for the sites increased by just 0.9°F during the 86 years of record (1895-1980) relative to the most recent official POR of 1981-2010.
—41 of the 60 contiguous U.S. sites have experienced their warmest year on record in just the past six years (2011-2016). The last year that any of the 60 sites experienced its coolest year on record was 1985 (Kansas City, MO; Salem, OR; and Boise ID)
—The site in the contiguous U.S. with the greatest increase in annual average temperature over the past six years (POR 2011-2016) relative to the 1981-2010 baseline POR is San Diego, CA, with an increase of 2.4°F. Barrow, AK, has seen a rise of 3.1°F using the same criterion but with a shorter overall POR. The site with the least increase in temperature is Grand Junction, CO, with no change (0.0°). Curiously, nearby Salt Lake City, UT, has seen an increase of 2.1°.
—The top five warmest years since 1895, as measured by the number of the 60 sites that experienced their warmest year on record, were:
2012: 25 sites
2016: 6 sites
1934: 6 sites
2015: 5 sites
2014: 4 sites
…and the top five coolest years were:
1917: 13 sites
1912: 6 sites
1904: 4 sites
1895, 1951, 1976, 1985: each year 3 sites
How Is 2017 faring so far?
As of the end of August 2017, the following cities (from among the 60 I chose) are on track for their warmest year on record (with their record year in parentheses).
Brownsville: (2012)
Cape Hatteras: (2011)
El Paso: (2016)
Houston: (2012)
Louisville: (2012)
Raleigh: (1990)
Salt Lake City: (2012)
San Antonio: (2006 and 1933)
Savannah: (1990)
Tampa: (2015)
Other major cities outside my 60-site list that are also on track for their warmest year on record include Miami, Tucson, Las Vegas, Austin, and Montgomery, according to NOAA’s August National Climate Report.
Ordinarily, it would not be too shocking to see a handful of cities with a 6-year average that sits 1°F above or below their 30-year average. In this case, however, we have 41 out of all 60 cities with a 6-year average that is at least 1°F above the prior 30-year average. Likewise, it would be expected for a few cities to have their warmest or coldest year in a six-year period—but it is startling to see 41 of 60 cities having their warmest year, and none of the 60 cities having their coldest year, from 2011 to 2016. Given the very warm year now under way, there appears to be no end in sight to the U.S. heat of the 2010s.
Christopher C Burt
Weather Historian
KUDOS: Thanks to Mark Stroud of Moon Street Cartography for creating the table graphics.
Notes:
Amarillo: An annual average of 64.6° in 1947 is missing 8 months of data that year.
Burlington: An annual average of 50.4° in 1901 is missing 2 months that year.
Grand Junction: An annual average of 49.7° in 1903 is missing October that year.
Reno: An annual average of 44.7° in 1898 is missing 2 summer months of data that year.
St. Louis: An annual average of 61.2° in 1895 is missing 3 months of data that year.
Tallahassee: An annual average of 72.5° in 1906 is missing 4 months of data that year.
Editor's note: We will be back with our next look at the tropics on Tuesday.


