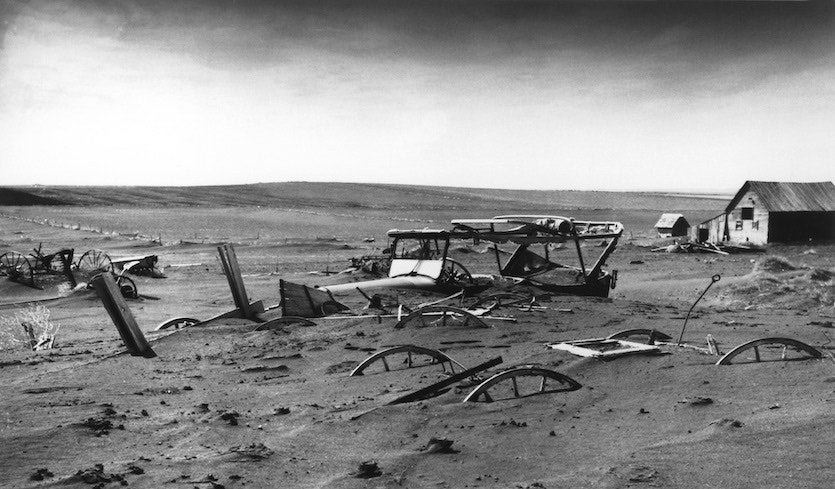
| Above: Farm machinery lies buried in dust in Dallas, South Dakota, on May 13, 1936, encapsulating the destruction of the 1930s Dust Bowl across the Great Plains. This photo was taken just weeks before the extreme heat of summer 1936 enveloped large parts of North America. Image credit: U.S. Department of Agriculture, via Wikimedia Commons. |
Every summer some region of the U.S. experiences a “record-breaking” heat wave, as occurred earlier this summer in northern New England, Quebec, and California. But the most intense and widespread heat wave (actually a series of heat waves) ever recorded in the U.S. occurred during the summer of 1936, when 17 of the 48 contiguous U.S. states and two provinces of Canada tied or broke their all-time heat records, along with hundreds of cities. Many of these records stand today. Although we have some clues, it is ultimately a bit of a mystery as to what exactly caused the temperatures to spike so high that summer.
A summer of extremes
The climatological summer (June-August) of 1936 remains the warmest nationwide on record (since 1895) with an average temperature of 74.0°F. (The second warmest summer was that of 2012 with an average of 73.7°F.)
July 1936 is still the single warmest U.S. month ever measured, with an average temperature of 76.8°F beating out July 2012 by just 0.02°F.
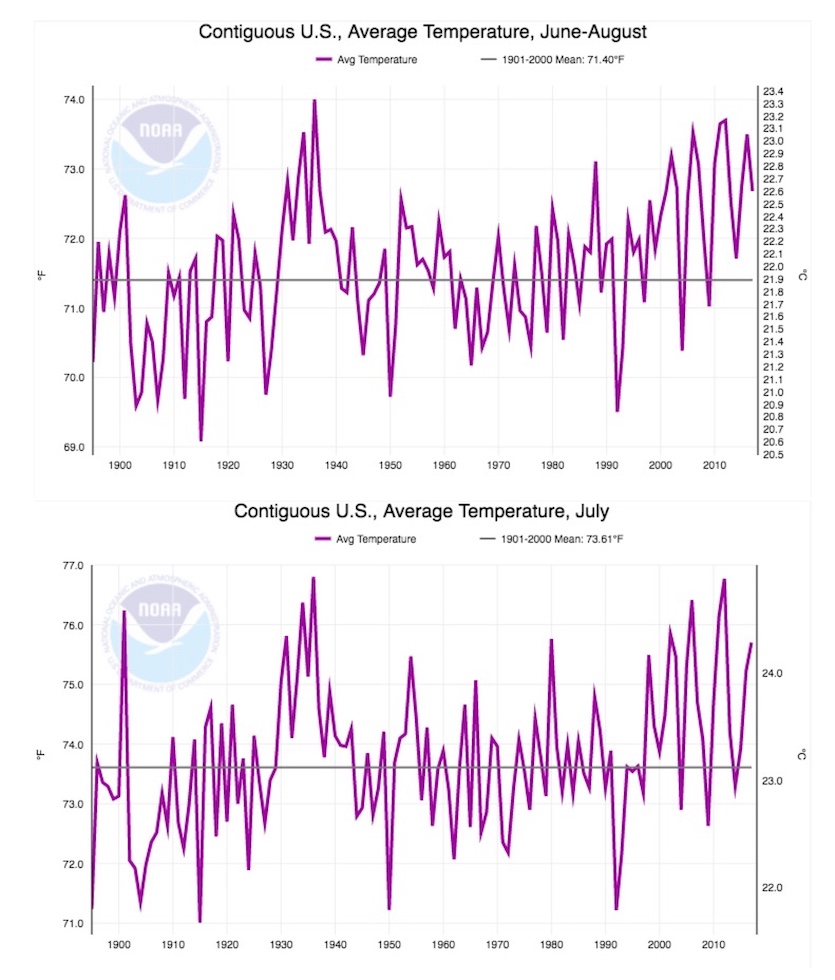 |
| Figures 1 and 2. The warmest climatological summer (June-August) on record in the contiguous U.S. was that of 1936 (top graph), and the warmest calendar month of all was July 1936 (bottom graph). Image credit: NOAA/NCEI. |
Interestingly, February 1936 remains the coldest February on record for the contiguous U.S., with an average nationwide temperature of 25.2°F. (The single coldest month on record was January 1977, with a 21.9°F average.) Temperatures fell as low as –60°F in North Dakota, an all-time state record. Turtle Lake, North Dakota averaged –19.4°F for the entire month, the coldest average temperature ever recorded in the contiguous United States for any month. One town in North Dakota, Langdon, stayed below 0°F for 41 consecutive days (from January 11 to February 20), the longest stretch below zero (including maximum temperatures) ever endured at any site in the lower 48.
With this in mind, it is truly astonishing what occurred the following summer. In North Dakota, where temperatures had dipped to –60°F on February 15, 1936, at Parshall, it hit 121°F at Steele by July 6. The two towns are just 110 miles from one another!
June of 1936 saw unusual heat build initially in two nodes, one centered over the Southeast and another over the Rocky Mountains and western Plains. By the end of June 1936, all-time state monthly records for heat had been established in Arkansas (113°F at Corning on June 20), Indiana (111°F at Seymore on June 29), Kentucky (110°F at St. John on June 29), Louisiana (110°F at Dodson on June 20th), Mississippi (111°F at Greenwood on June 20), Missouri (112°F at Doniphan on June 20), Nebraska (114°F at Franklin on June 26), and Tennessee (110°F at Etowah on June 29).
Then the heat really cranked up. By July, the dome of heat was locked in place over the central and northern Great Plains, and it remained there for the entire month.
 |
| Figure 3. Map of departure from normal average temperatures in the contiguous U.S. during July 1936. Virtually the entire country was warmer than normal, but the most anomalous heat was centered over the Plains and Midwest. Map from Monthly Weather Review, July 1936, U.S. Weather Bureau/American Meteorological Society. |
Around July 8-10, the extreme heat briefly extended all the way to the East Coast when virtually every absolute maximum temperature record was broken from Virginia to New York. This held true for most sites in the Ohio Valley, Upper Midwest, and Great Plains as well. There are so many superlatives that it is impossible to list them all. In short, the following states broke or tied their all-time maximum temperatures that July:
Indiana: 116°F (Collegeville, July 14)
Iowa*: 117°F (Atlantic and Logan, July 25)
Kansas: 121°F (Fredonia, July 18, and Alton, July 24)
Maryland: 109°F (Cumberland and Frederick, July 10)
Michigan: 112°F (Mio, July 13)
Minnesota: 114°F (Moorhead, July 6)
Missouri: 118°F (Clinton, July 15, and Lamar, July 18)
Nebraska: 118°F (Hartington, July 17, and Minden, July 24)
New Jersey: 110°F (Runyon, July 10)
North Dakota: 121°F (Steele, July 6)
Oklahoma: 120°F (Alva, July 18, and Altus, July 19)
Pennsylvania: 111°F (Phoenixville, July 10)
West Virginia: 112°F (Martinsburg, July 10)
Wisconsin: 114°F (Wisconsin Dells, July 13)
*The 118°F reported from Keokuk 2 on July 20, 1934, is almost certainly false. No other site in Iowa measured above 112°F that day, and the NWS Keokuk site measured just 109°F.
Some of the many major U.S. cities to record their all-time maximum temperatures during July 1936 (many of these records still stand) included:
New York City, NY: 106°F (July 10)
Baltimore, MD: 107°F (July 10)
Columbus, OH: 106°F (July 14)
Louisville, KY: 107°F (July 14)
Des Moines, IA: 110°F (July 25)
Minneapolis, MN: 108°F (July 14)
Bismarck, ND: 114°F (July 6)
Omaha, NE: 114°F (July 25)
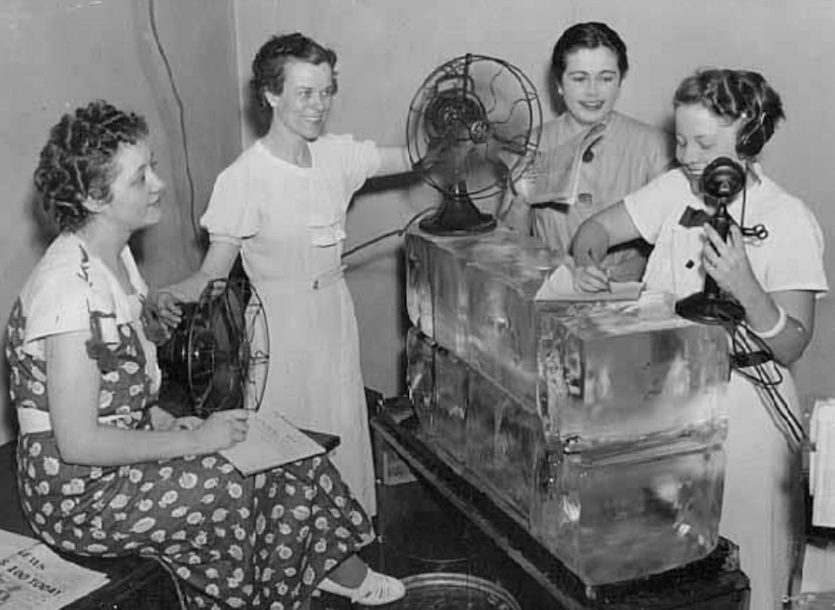 |
| Figure 4. When the temperature peaked at an all-time high of 108°F in Minneapolis, Minnesota, on July 14, 1936, the want-ad staff at the St. Paul Daily News was provided with 400 pounds of ice and two electric fans to cool the air in the press room. Local newspapers noted that 51 heat-related fatalities occurred in the city on just this day alone. Image credit: Minnesota Historical Society. |
On July 15, the average high temperature for all the official weather sites in Iowa measured 108.7°F. Nighttime low temperatures were also remarkably warm. Bismarck recorded a low of just 83°F on July 11. Milwaukee, Wisconsin, endured five consecutive nights above 80°F from July 8 to 13. Even near the normally cool shores of Lake Erie, amazing temperatures were observed, such as the low of 85°F and high of 110°F at Corry, Pennsylvania, on July 14. Most amazing of all was the low of 91°F at Lincoln, Nebraska, on the night of July 24-25, warming to an all-time record high of 115°F on the 25th.
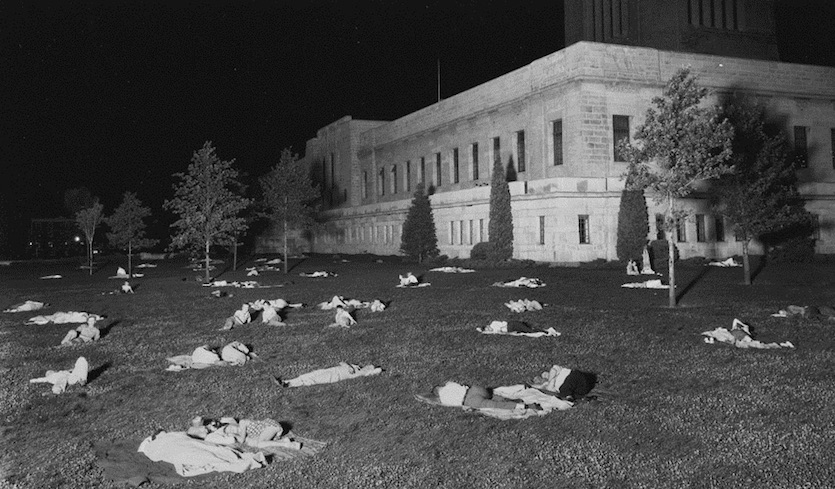 |
| Figure 5. Residents of Lincoln, Nebraska spend the night on the lawn of the state capital on July 25, 1936. The temperature that night never fell below 91°F, perhaps the warmest night ever recorded anywhere in the United States outside of the desert Southwest. Image credit: Nebraska State Historical Society, via History Nebraska. |
By August the heat dome shifted a bit further south from its position over the northern Plains and became anchored over the southern Plains.
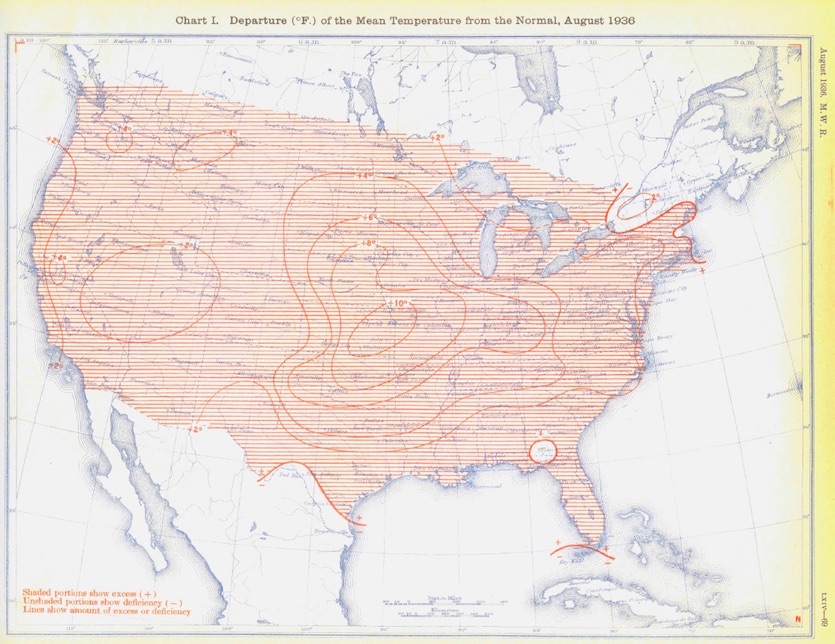 |
| Figure 6. Temperature departure from average during August 1936. The core of the anomalous heat shifted a bit to the south and east relative to July. Map from Monthly Weather Review, August 1936, U.S. Weather Bureau/American Meteorological Society. |
More all-time state records were broken or tied:
Arkansas: 120°F (Ozark, Aug. 10)
Louisiana: 116°F (Plain Dealing, Aug. 10)
Oklahoma: 120°F (Poteau, Aug. 10, and Altus, Aug. 12)
Texas: 120°F (Seymour, Aug. 12)
Oklahoma City also broke its all-time heat record with a high of 113°F on August 11, as did Kansas City with 113°F on August 14 and Wichita with 114°F on August 12, just to name just a few.
All in all, nothing comparable to the heat wave(s) of the summer of 1936 has before or since occurred in the contiguous U.S. It is hard to imagine how people fared without home air conditioning, although there were some rudimentary forms available, such as swamp coolers. Movie theaters were one of the few places where air conditioning provided at least some temporary relief.
In summary, 17 states broke or tied their all-time record maximum temperatures during that summer, all of which still stand.
Below is a map reproduced from my book Extreme Weather: A Guide and Record Book that summarizes some of the records broken:
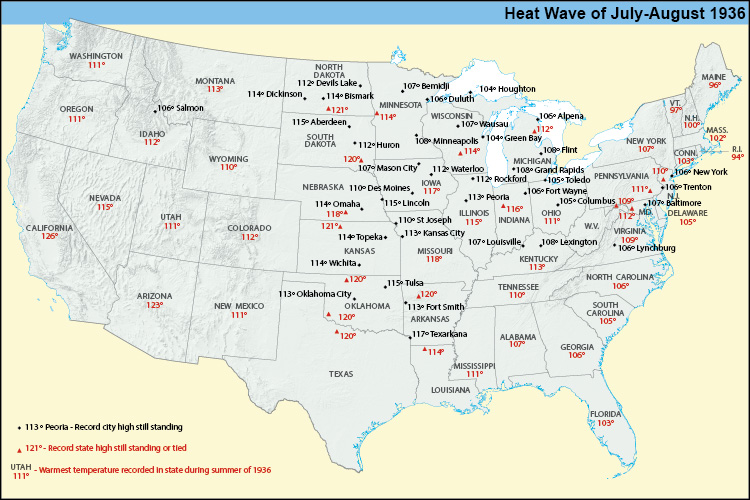 |
| Figure 7. A map summarizing the extreme heat records attained during the summer of 1936. All temperatures shown were recorded in July or August 1936. Red triangles denote where temperatures from July-August 1936 set all-time records for that state, and the cities shown each set all-time heat records. All of the records noted on the map are still standing except for the all-time high at Fort Smith, Arkansas, which reached 115°F on August 3, 2011. Trenton, New Jersey; Oklahoma City, Oklahoma; and the states of Texas and South Dakota have tied the records first set in 1936. Image credit: Map by Mark Stroud from my book Extreme Weather: A Guide and Record Book. |
Canada
The plains of Manitoba and portions of southwestern Ontario also experienced some of their hottest temperatures ever observed. Winnipeg, the capital of the province of Manitoba, reached an all-time high of 108°F (42.2°C) on July 11. (The Fahrenheit reading serves as the official record, because in 1936 Canada still measured its temperatures in Fahrenheit rather than Celsius). Across the 13 days from July 5 to 17, Winnipeg reached or exceeded 86°F (30°C) on each day, a still-standing record for consecutive heat at the site. The minimum temperature on the night of July 11-12 was 83°F (28.3°C), the warmest daily minimum on record for the site and perhaps for all of Canada.
At least 31 people perished from the heat in the city, making this the deadliest weather-related incident in Winnipeg’s history. Elsewhere in Manitoba, another 40 heat-related fatalities were reported by the press, and the province broke its all-time heat record with readings of 112°F (44.4°C) observed at Emerson on July 12 and St. Albans on July 11. Emerson saw an unbelievable nine consecutive days of readings at or above 100°F (37.8°C), from July 5 to 13.
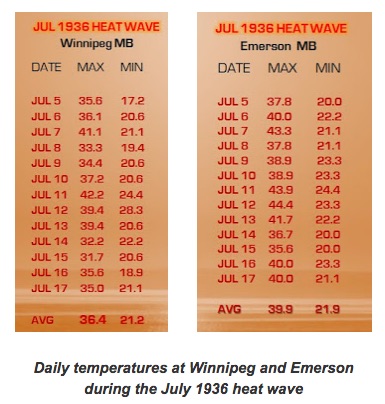 |
| Figure 8. Chart of the remarkable daily temperatures at Winnipeg and Emerson, Manitoba, during the July 1936 heat event. Image credit: Adapted from Rob’s Blog, which features a superb summary of this event in Manitoba. |
The only hotter temperatures ever measured in Canada were a pair of 113°F (45.0°C) readings in the Saskatchewan towns of Midale and Yellowgrass in July 1937. The province of Ontario also achieved its hottest temperatures ever observed with 108°F (42.2°C) measured at Atikokan on July 11 and 12, 1936, and at Fort Frances on July 13. In Toronto, temperatures reached 105°F (40.6°C), the city’s hottest temperature on record; 275 heat-related fatalities were reported. All in all, some 1,100 heat fatalities were reported in Canada from the heat wave(s) in the summer of 1936, at a time when Canada’s entire population was less than 11 million. Per capita, this would be the rough equivalent of about 32,000 heat deaths in the U.S. in a single summer today.
Heat-related fatalities during the summer of 1936
It is not known how many such deaths occurred in the U.S. over the course of this long hot summer. The international disasters database EM-DAT lists the North American heat wave of 1936 as the sixth deadliest heat wave in modern world history.
EM-DAT’s Ten Deadliest Heat Waves in World History
1) Europe, 2003: 71,310
2) Russia, 2010: 55,736
3) Europe, 2006: 3,418
4) India, 1998: 2,541
5) India, 2015: 2,500
6) U.S. and Canada, 1936: 1,693
7) U.S., 1980: 1,260
8) India, 2003: 1,210
9) India, 2002: 1,030
9) Greece and Turkey, 1987: 1,030
The EM-DAT figures for the 1936 heat wave are almost certainly on the low side, as they are based only on 1193 heat deaths reported in Illinois in July 1936 and some 500 from Canada. Local press reports mentioned 479 heat deaths in St. Louis alone, 51 in Minneapolis, 284 in Indiana, 275 in Toronto, and 70 in Manitoba, among the few numbers one can find searching press reports from the time.
The publication "Mortality Statistics 1936" (see PDF file), from the U.S. Department of Commerce, lists 4,678 U.S. deaths attributed to excessive heat in 1936, as compared to 728 in 1935. It would be illuminating to utilize the current practice of determining “excess deaths” that occurred versus direct heat-related fatalities. It might, however, be next to impossible to calculate this at this late date.
What caused the anomalous heat during the summer of 1936?
Many people have wondered just why the temperatures reached such anomalous heights that summer. There was no La Niña event (which often results in summer heat waves in the U.S.), according to historical analysis of such. The Pacific Decadal Oscillation was in a strongly positive mode, according to NOAA.
One widely accepted theory is that the Dust Bowl drought (which was in its third year by 1936), combined with unsustainable land-use practices in the preceding years, degraded ground cover to such a degree in the Plains and Midwest that the air became unusually dry and super-heated, thus facilitating extremely high temperatures. This would mean that, given improved agricultural practices, such temperatures are not likely to occur again anytime soon (at least on such a broad scale). Of course, climate change will make that assumption less likely sooner or later.
The impact of the 1930s drought and Dust Bowl on the extreme temperatures was analyzed by earth scientists Benjamin Cook and Richard Seager in a 2009 paper published by the National Academy of Sciences. The authors found that climate models that included the sea surface temperatures prevailing at the time were able to replicate the 1930s drought. However, the models incorrectly placed the center of the drought across the southwest U.S., and they did not replicate the extreme heat over the Central and Northern Plains. The models did much better at reproducing the fingerprint of 1930s heat when they included the lack of vegetation and the widespread blowing dust prevalent over the Great Plains.
However, this can only explain one facet of the 1936 heat event, since all-time record maximum temperatures were also observed from Idaho in the west to New York and New Jersey in the east, far from the area impacted by the drought. It would be useful to run a reanalysis of the meteorological elements in play during that torrid summer in the hopes of unlocking the full story behind this event and determining what the odds of a repeat might be. It has been six years since the last major summer-long heat event (summer of 2012) affected the Midwest and the eastern half of the U.S.
Christopher C. Burt
Weather Historian
KUDOS: To Mark Stroud of Moon Street Cartography for the map of temperature records established in the U.S., and to Bob Henson for his invaluable input and editing.
